ECZ · Paper 1 — Statistics
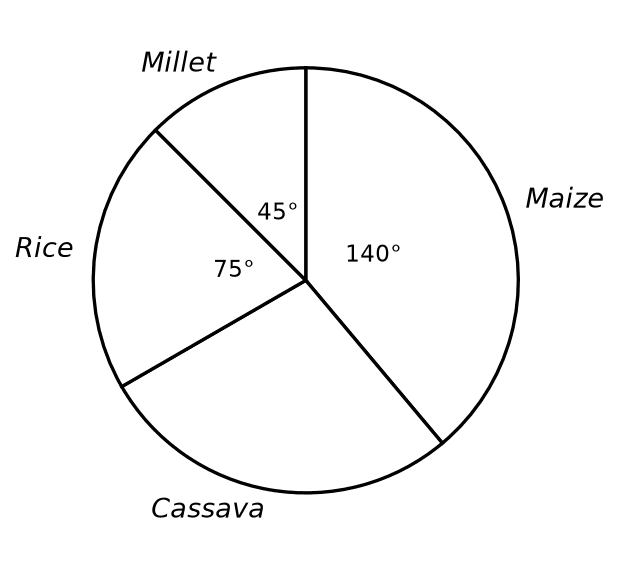
The pie chart shows the main crop grown by a group of farmers. The sector for millet represents 9 farmers. How many farmers were in the group?
- A. 54
- B. 72
- C. 90
- D. 108
Verified working — step 1
The millet sector is 45°, representing 9 farmers, so 45° corresponds to 9 farmers and 1 farmer is represented by 5°. The whole pie is 360°, so the number of farmers = 360 ÷ 5 = …The full step-by-step working and final answer are included with Premium — checked against ECZ marking standards.
Original examination question © Examinations Council of Zambia. Worked solution and commentary © G12 Titan — not to be reproduced without permission.
Have a different question?
Search it — if it is from a past paper or a school mock, chances are we have it worked out, or one that uses the same method.
Search any past-paper question