
Save as PDF or print — the answers and worked solutions live online, where your work gets marked free.
Examinations Council of Zambia — past paper
ECZ 2014 O-Level Paper 1 — Mathematics
34 questions · downloaded from g12titan.com, where this paper is marked free online

1.
Simplify 7a + 2b − 4(3a − b).
- A−5a − 2b
- B19a − 2b
- C−5a + 6b
- D−5a − 6b
2.
Given that P = 3-1-20 and Q = 34-4x, find the value of x if P and Q have equal determinants.
- A6
- B−163
- C143
- D−6
3.
Factorise completely 5x2 − x − 4.
- A(5x + 4)(x − 1)
- B(5x − 4)(x + 1)
- C(x + 4)(5x − 1)
- D(5x + 2)(x − 2)
4.
When a car was sold at K12 000.00, a profit of 20% was made. What was the cost price?
- AK9 600.00
- BK10 000.00
- CK14 400.00
- DK2 400.00
5.
The brand names IYALOWA, YONZUNA, YATOWALA, YEMUNATI, YATOBALA, ILWEELA and CHINAYEME contain 54 letters in total, of which 3 are T and 3 are W. One letter is chosen at random from these words. Find the probability that it is either a T or a W.
- A19
- B118
- C29
- D16
6.
The Venn diagram shows the number of pupils who take Mathematics (M), Physics (P) and Chemistry (C) at Imishila Secondary School. Write an expression, in terms of x, for the total number of pupils who take Physics.
- Ax + 8
- B2x + 5
- C2x + 8
- Dx + 5
7.
In the Venn diagram shown, 22 pupils take Physics and 20 pupils take Mathematics. Find x and y.
- Ax = 7, y = 2
- Bx = 7, y = 3
- Cx = 11, y = 2
- Dx = 14, y = 2
8.
Solve the equation 2(x − 2)2 = 18.
- Ax = 5 or x = −1
- Bx = 5 or x = 1
- Cx = 3 or x = −3
- Dx = 11 or x = −7
9.
Evaluate −42 + 43.
- A80
- B48
- C−80
- D−48
10.
The regular hexagon shown is divided into 12 congruent triangles, two of which are already shaded. Which diagram shows two more triangles shaded so that the figure has exactly two lines of symmetry?
- A

- B

- C

- D

11.
Two places A and B lie on the equator and are 2 820 nautical miles apart. A is on longitude 17°W and B is east of A. Find the longitude of B.
- A30°E
- B64°E
- C30°W
- D47°E
12.
A function is defined by f(x) = 10x + 9. Find f(−2).
- A−20
- B29
- C11
- D−11
13.
A function is defined by f(x) = 10x + 9. Find f-1(x).
- Ax + 910
- Bx − 910
- C10x − 9
- D110x + 9
14.
A square park has its map drawn to a scale of 1 : n. Four beacons P, Q, R and S are placed at the four corners of the park. Beacons P and Q, which are 240 m apart on the ground, are 12 cm apart on the map. Find the value of n.
- A2 000
- B20
- C20 000
- D200 000
15.
A square park has beacons at its four corners; two adjacent beacons are 240 m apart on the ground. Find the actual area of the park in square kilometres.
- A57 600 km2
- B5.76 km2
- C0.0576 km2
- D0.576 km2
16.
Given that y = kx2 − 1, where k is a constant, and that y = 17 when x = 3, find the value of k.
- A2
- B169
- C18
- D6
17.
Given that y = 2x2 − 1, find the value of y when x = −5.
- A−51
- B49
- C51
- D99
18.
Given that y = 2x2 − 1, find the values of x when y = 7.
- Ax = 2 only
- Bx = 2 or x = −2
- Cx = 4 or x = −4
- Dx = 3 or x = −3
19.
The diagram shows an isosceles triangle ABC in which AB = AC = 41 cm, BC = 18 cm and D is the midpoint of BC. Calculate the length of AD.
- A32 cm
- B√1762 cm
- C40 cm
- D20 cm
20.
In the diagram, O is the centre of the circle ABCD. AC is a diameter, AD and BC are produced to meet at E, angle CED = 27° and angle ACB = 43°. Find angle ADB.
- A43°
- B47°
- C27°
- D86°
21.
In the diagram, O is the centre of the circle ABCD. AC is a diameter, AD and BC are produced to meet at E, angle CED = 27° and angle ACB = 43°. Find angle CAD.
- A27°
- B16°
- C47°
- D63°
22.
In the diagram, O is the centre of the circle ABCD. AC is a diameter, AD and BC are produced to meet at E, angle CED = 27° and angle ACB = 43°. Find angle DCE.
- A90°
- B27°
- C117°
- D63°
23.
Given that 3x = 2y, find the ratio x : y.
- A1 : 6
- B3 : 2
- C2 : 3
- D6 : 1
24.
A kite (K) being flown is such that its vertical height HK is 6 m and the angle between the vertical height and the string SK is 60°, as shown. Given that sin 60° = 0.866, cos 60° = 0.5 and tan 60° = 1.73, calculate the length of the string SK.
- A10.38 m
- B3 m
- C6.93 m
- D12 m
25.
The diagram shows a sector AOB in which OA = 4 cm and angle AOB = 45°. Find the area of the sector. Take π to be 3.14.
- A12.56 cm2
- B6.28 cm2
- C1.57 cm2
- D3.14 cm2
26.
Part of the graph of y = x3 is sketched for x ≤ 0. Which sketch shows the completed graph of y = x3?
- A

- B

- C

- D

27.
The ratio of the surface areas of two similar solids is 1 : 64. Calculate the ratio of their volumes.
- A1 : 8
- B1 : 4 096
- C1 : 512
- D1 : 64
28.
The diagram shows two shapes ABCD and PQRS on an XOY plane. Describe fully the single transformation which maps ABCD onto PQRS.
- ARotation of 90° anticlockwise about (−1, 2)
- BRotation of 90° clockwise about (−1, 2)
- CRotation of 90° anticlockwise about the origin
- DRotation of 180° about (−1, 2)
29.
An outing expedition centre charges K300.00 per person for a full day, K200.00 per person for half a day and K500.00 fixed charge per group for admission to the centre. Find the total amount that a group of 12 would pay if it intended to stay in the centre from Monday to Friday.
- AK18 000.00
- BK18 500.00
- CK24 000.00
- DK25 700.00
30.
The unshaded region R in the diagram is defined by four inequalities. The broken line is not part of the region. Which set of inequalities defines R?
- Ax > 1, x ≤ 2, y ≤ 1, y ≥ x − 2
- Bx > 1, x ≤ 2, y ≥ 1, y ≥ x − 2
- Cx > 1, x ≤ 2, y ≤ 1, y ≤ x − 2
- Dx < 1, x ≥ 2, y ≤ 1, y ≥ x − 2
31.
Given that A is a point (3, 2) and B is a point (−1, 5), find AB as a column vector.
- A4-3
- B-43
- C27
- D-4-3
32.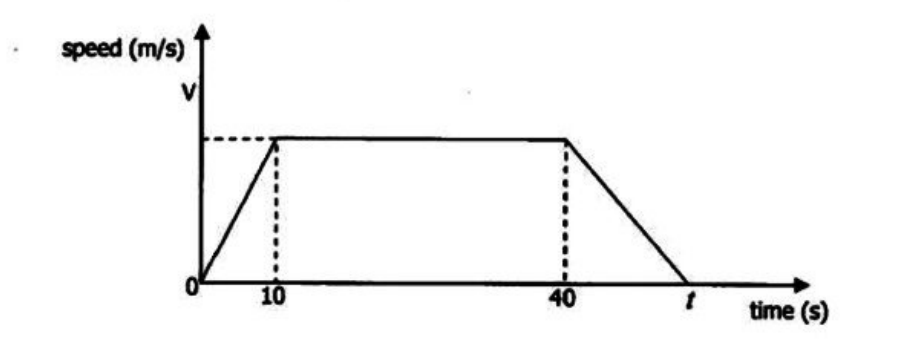
The diagram is the speed–time graph of a bus which leaves a bus stop and accelerates uniformly for 10 seconds over a distance of 100 m, maintains that speed for 30 seconds and then retards uniformly to rest at the next bus stop. Find the value of V.
- A20 m/s
- B10 m/s
- C40 m/s
- D200 m/s
33.
For the bus journey shown, the bus reaches 20 m/s after 10 seconds. Find the acceleration in the first 10 seconds.
- A20 m/s2
- B0.5 m/s2
- C2 m/s2
- D10 m/s2
34.
For the bus journey shown, V = 20 m/s and the two bus stops are 1 kilometre apart. Find the total time, t, taken for the whole journey, in seconds.
- A100
- B50
- C65
- D70