
Save as PDF or print — the answers and worked solutions live online, where your work gets marked free.
Examinations Council of Zambia — past paper
ECZ 2018 GCE Paper 1 — Mathematics
44 questions · downloaded from g12titan.com, where this paper is marked free online

1.
Use set notation to describe the shaded region in the Venn diagram below.
- AA∪B
- B(A∪B)∩C′
- CC∩(A∪B)
- DA∩B∩C′
2.
Given that E={1,2,3,4,5,6,7,8},A={1,2,3,4} and B={2,3,4,5,6}, list (A∪B)'.
- A{1,7,8}
- B{1,2,3,4,5,6}
- C{5,6,7,8}
- D{7,8}
3.
Simplify 4(x + 2y) − (3x − 8y).
- Ax + 16y
- Bx
- C7x + 16y
- Dx − 16y
4.
Evaluate 2723.
- A18
- B3
- C9
- D81
5.
A straight line passing through A(3, 2) and B(5, y) has gradient −2. Find the value of y.
- A−6
- B−2
- C6
- D2
6.
Factorise completely 5x2 − 5.
- A5(x2 − 1)
- B(5x − 5)(x + 1)
- C5(x − 1)2
- D5(x − 1)(x + 1)
7.
Given that C = 5-121 and D = 1-2, express CD as a single matrix.
- A[3; 0]
- B[7; 0]
- C[7; 4]
- D[3; 4]
8.
The first three terms in an arithmetic progression are 5, 7 and 9. Find the common difference.
- A5
- B4
- C−2
- D2
9.
The first three terms in an arithmetic progression are 5, 7 and 9. Find the sum of the first 12 terms.
- A192
- B27
- C384
- D96
10.
In a game, the probability of a player losing is 0.3. What is the probability of the player winning the game?
- A0.3
- B0.7
- C0.4
- D1
11.
The coordinates of B and C are (2, 5) and (4, −3) respectively. If M is the mid-point of BC, what is the position vector of M?
- A[6; 2]
- B[1; −4]
- C[3; −1]
- D[3; 1]
12.
The scale of a map is 1 : 20 000. The actual area of residential plots is 60 km2. Calculate the area of residential plots on the map in square centimetres.
- A15 cm2
- B1500 cm2
- C150 cm2
- D3000 cm2
13.
The difference in longitude between town A and town B is 105°. B is west of A. A family at A was watching a football match at 16 00 hours. At what time did a family at B watch the same match?
- A23 00 hours
- B11 00 hours
- C09 00 hours
- D07 00 hours
14.
The distance between P and Q is 3 600 nautical miles. If an aeroplane flies from P to Q at 600 knots, how long will it take?
- A6 hours
- B60 hours
- C6 minutes
- D12 hours
15.
The transpose of a matrix P is 134251301. Write down the matrix P.
- A[1 2 3; 3 5 0; 4 1 1]
- B[1 3 4; 2 5 1; 3 0 1]
- C[3 0 1; 2 5 1; 1 3 4]
- D[4 3 1; 1 5 2; 1 0 3]
16.
Solve the equation 22x − 1 = 16−2x.
- Ax = −16
- Bx = 110
- Cx = 12
- Dx = −110
17.
The diagram below shows a sector AOB of a circle with centre O and radius 7 cm. The area of the sector is 25⅔ cm2. [π = 227]
Calculate AÔB.
- A30°
- B120°
- C60°
- D45°
18.
Ngiwezi invested K14 500.00 in a business firm. The condition was that if she left her shares in the firm for 12 months, a profit of 5% would be added to her shares. How much will she get at the end of 12 months?
- AK725.00
- BK15 950.00
- CK13 775.00
- DK15 225.00
19.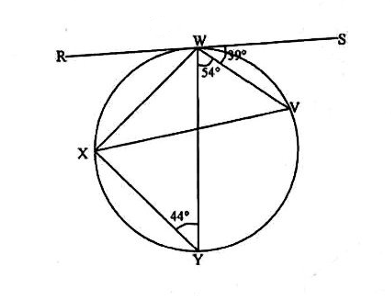
The diagram below shows a circle with a tangent RWS. The points V, W, X and Y are on the circle such that XŶW = 44°, VŴY = 54° and SŴV = 39°. Calculate RŴX.
- A39°
- B54°
- C43°
- D44°
20.
The diagram below shows a circle with a tangent RWS. The points V, W, X and Y are on the circle such that XŶW = 44°, VŴY = 54° and SŴV = 39°. Calculate XṼW.
- A54°
- B44°
- C39°
- D88°
21.
The diagram below shows a circle with a tangent RWS. The points V, W, X and Y are on the circle such that XŶW = 44°, VŴY = 54° and SŴV = 39°. Calculate YX̂W.
- A88°
- B93°
- C98°
- D83°
22.
The ratio of the heights of two containers that are geometrically similar is 2 : 3. If the surface area of the smaller container is 80 cm2, find the surface area of the larger container.
- A120 cm2
- B270 cm2
- C180 cm2
- D360 cm2
23.
In the diagram, triangle ABC has vertices A(1, 3), B(1, 1) and C(4, 1). It is mapped onto triangle STU with vertices S(−4, −6), T(−4, −4) and U(−1, −4) by a combined transformation. Name the two transformations that map triangle ABC onto triangle STU.
- AA reflection in the x-axis followed by a translation by [−5; −3]
- BA rotation of 180° about the origin followed by a translation by [−3; −5]
- CA reflection in the y-axis followed by a translation by [−5; −3]
- DA rotation of 90° clockwise about the origin followed by a translation by [−5; −3]
24.
Two variables x and y have the following corresponding values: when x = 2, y = 20; when x = 3, y = 40; when x = a, y = 104. Given that y varies directly as (x2 + 1), find the constant of variation, k.
- A4
- B5
- C20
- D14
25.
Two variables x and y are such that y varies directly as (x2 + 1), and when x = 2, y = 20. Find the equation connecting y and x.
- Ay = 4x2
- By = 4(x2 + 1)
- Cy = 4x2 + 1
- Dy = x2 + 4
26.
Two variables x and y are such that y = 4(x2 + 1). Given that y = 104 when x = a, find the values of a.
- A5
- B25
- C±6
- D±5
27.
Given that f(x) = 8x, find f-1(x).
- A8x
- B−8x
- Cx8
- D18x
28.
Given that f(x) = 8x and g(x) = 3x − 24, find an expression for fg(x).
- A6x − 4
- B24x − 24
- C6x − 2
- D3x − 232
29.
Given that f(x) = 8x and g(x) = 3x − 24, find the value of x for which fg(x) = 20.
- A83
- B24
- C4
- D3
30.
In the diagram below, a cyclist starts from town W and cycles on a bearing of 216° to town P. She then leaves town P and cycles on a bearing of 296° to Z. Z is west of W. Calculate PŴZ.
- A44°
- B36°
- C64°
- D54°
31.
In the diagram below, a cyclist starts from town W and cycles on a bearing of 216° to town P. She then leaves town P and cycles on a bearing of 296° to Z. Z is west of W. Calculate WṖZ.
- A90°
- B116°
- C100°
- D80°
32.
The diagram shows a regular hexagonal prism. State the number of planes of symmetry.
- A6
- B7
- C8
- D12
33.
A piece of timber measures 5.25 cm long. Calculate the relative error of the measurement.
- A1105
- B1525
- C11050
- D12100
34.
Integrate 3x4 − 4x-3 with respect to x.
- A(35)x5 + 2x2 + c
- B(35)x5 − 2x2 + c
- C(35)x2 − 2x2 + c
- D12x3 + 12x-4 + c
35.
Solve the equation (2x − 1)2 = 25.
- Ax = 3 only
- Bx = −2 or x = 3
- Cx = −3 or x = 2
- Dx = 13 or x = −12
36.
Find the equation of a line which is parallel to 2x + y = 3 passing through (−2, 3).
- Ay = −2x + 1
- By = 2x + 7
- Cy = −2x − 1
- Dy = −½x + 2
37.
In triangle XYZ, the side opposite angle X is x = YZ, the side opposite Y is y = XZ, and the side opposite Z is z = XY. A flow chart computes cos X: Begin → [input] → [process] → Output cos X → End. Which statements correctly complete the input and process boxes?
- AEnter x, y, z; cos X = y2 + z2 + x22yz
- BEnter x, y, z; cos X = y2 + z2 − x22yz
- CEnter x, y, z; cos X = x2 + z2 − y22xz
- DEnter y, z; cos X = y2 + z2 − x2yz
38.
In the diagram, R is the unshaded region bounded by three lines: the line through (0, 0) and (5, 5); the line through (0, 2) and (8, 0); and the line through (5, 5) and (8, 0). Write three inequalities which describe the region R.
- Ay ≤ x, y ≥ −¼x + 2, y ≤ −⁵⁄₃x + ⁴⁰⁄₃
- By ≥ x, y ≤ −¼x + 2, y ≥ −⁵⁄₃x + ⁴⁰⁄₃
- Cy ≤ x, y ≥ −¼x + 2, y ≤ −⅓x + 8
- Dy ≤ x, y ≤ −¼x + 2, y ≤ −⁵⁄₃x + ⁴⁰⁄₃
39.
Given a right-angled triangle XYZ where ∠Z is 90° and sin X = 45, find the value of cos X.
- A45
- B34
- C35
- D43
40.
The diagram below shows a sketch of a graph which meets the x-axis at −4 and 2. Find the equation of the graph.
- Ay = x2 + 2x − 8
- By = x2 − 2x − 8
- Cy = −x2 − 2x + 8
- Dy = x2 + 2x + 8
41.
The diagram shows a sketch of the parabola y = x2 + 2x − 8, which meets the x-axis at −4 and 2. Find the coordinates of the turning point.
- A(−1, −5)
- B(1, −9)
- C(−1, −9)
- D(−2, −8)
42.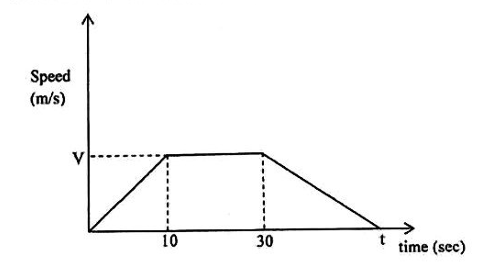
The speed-time graph shows a particle which started from rest and accelerated uniformly for 10 seconds to a speed V. It then travelled at constant speed for 20 seconds and then decelerated to rest at time t. Find the speed V the particle reached if its acceleration was 2 m/s2 in the first 10 seconds.
- A5 m/s
- B20 m/s
- C2 m/s
- D40 m/s
43.
The speed-time graph shows a particle which accelerated uniformly from rest to 20 m/s in 10 seconds, travelled at 20 m/s for 20 seconds, then decelerated to rest at time t. Given that the total distance covered was 750 m, find the value of t.
- A50
- B65
- C45
- D55
44.
The speed-time graph shows a particle which accelerated uniformly from rest to 20 m/s in 10 seconds, travelled at 20 m/s for 20 seconds, then decelerated uniformly to rest at t = 55 seconds. What was the speed at 40 seconds?
- A8 m/s
- B12 m/s
- C16 m/s
- D10 m/s