
Save as PDF or print — the answers and worked solutions live online, where your work gets marked free.
Examinations Council of Zambia — past paper
ECZ 2018 GCE Paper 2 — Mathematics
12 questions · downloaded from g12titan.com, where this paper is marked free online

1.
(a)
Given that matrix A = 2x23x,
(a(i))
find the positive value of x for which the determinant of A is 12, [2]
(a(ii))
hence or otherwise, write A-1. [2]
(b)
Solve the equation x2 - 4x - 2 = 0, giving your answers correct to 2 decimal places. [5]
2.
(a)
Simplify 7st315u3v2 × 5u3v28s3t2. [2]
(b)
In a geometric progression, the third term is 29 and the fourth term is 227. Find
(b(i))
the first term and the common ratio, [3]
(b(ii))
the sum of the first 5 terms of the geometric progression, [2]
(b(iii))
the sum to infinity. [2]
3.
(a)
The diagram below shows how learners in a Grade 12 class at Twaenda School travel to school. The learners use either buses (B), cars (C) or walk (W) to school.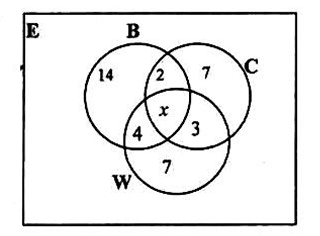
(a(i))
If 22 learners walk to school, find the value of x. [2]
(a(ii))
How many learners use
(a(ii)(a))
only one mode of transport, [1]
(a(ii)(b))
two different modes of transport? [1]
(b)
Show that the points L(-2, -10), M(2, 2) and N(5, 11) are collinear. [5]
4.
Answer the whole of this question on a sheet of plain paper.
(a(i))
Construct triangle PQR in which PQ = 10 cm, QR = 8 cm and angle PQR = 50°. [1]
(a(ii))
Measure and write the length of PR. [1]
(b)
On your diagram, within triangle PQR, construct the locus of points which are
(b(i))
equidistant from P and Q, [1]
(b(ii))
equidistant from PR and PQ, [2]
(b(iii))
5 cm from R. [1]
(c)
A point T within triangle PQR is such that it is 5 cm from R and equidistant from P and Q. Label the point T. [1]
(d)
Another point X is such that it is less than or equal to 5 cm from R, nearer to Q than P and nearer to PQ than PR. Indicate clearly, by shading, the region in which X must lie. [2]
5.
(a)
A box contains identical buttons of different colours. There are 20 black, 12 red and 4 white buttons in the box. Two buttons are picked at random one after another and not replaced in the box.
(a(i))
Draw a tree diagram to show all the possible outcomes. [3]
(a(ii))
What is the probability that both buttons are white? [2]
(b)
Study the pseudo code below.
Construct a flow chart corresponding to the pseudo code above. [5]
6.
The diagram below shows a bin in the form of a frustum with square ends of sides 4 cm and 10 cm respectively. The height of the bin is 9 cm.
(a)
Find the volume of the bin. [6]
7.
(a)
In the diagram below, A and B are points on latitude 60° N while C and D are points on latitude 60° S. [π = 3.142 and R = 3 437 nm]
(a(i))
Calculate the distance BC along the longitude 60°E in nautical miles. [2]
(a(ii))
A ship sails from C to D in 12 hours. Find its speed in knots. [4]
(b(i))
Determine the equation of the normal to the curve y = 2x2 - 3x - 2 that passes through the point (3, 7). [3]
(b(ii))
Evaluate ∫10 (x2 - 2x - 3) dx. [3]
8.
(a)
Three villages A, B and C are connected by straight paths as shown in the diagram below.
Given that AB = 15 km, angle ABC = 79° and angle ACB = 40°, calculate the
(a(i))
distance AC, [4]
(a(ii))
area of triangle ABC, [2]
(a(iii))
shortest distance from B to AC. [2]
(b)
Solve the equation cos θ = 0.937 for 0° ≤ θ ≤ 360°. [2]
(c)
Sketch the graph of y = sin θ for 0° ≤ θ ≤ 360°. [2]
9.
Answer the whole of this question on a sheet of graph paper.
A tailor at a certain market intends to make dresses and suits for sale.
(a)
Let x represent the number of dresses and y the number of suits. Write the inequalities which represent each of the conditions below.
(a(i))
The number of dresses should not exceed 50. [1]
(a(ii))
The number of dresses should not be less than the number of suits. [1]
(a(iii))
The cost of making a dress is K140.00 and that of a suit is K210.00. The total cost should be at least K10 500.00. [2]
(b)
Using a scale of 2 cm to represent 10 units on both axes, draw x and y axes for 0 ≤ x ≤ 60 and 0 ≤ y ≤ 80. Shade the unwanted region to indicate clearly the region where (x, y) must lie. [4]
(c)
The profit on a dress is K160.00 and on a suit it is K270.00.
(c(i))
Find the number of dresses and suits the tailor must make for maximum profit. [2]
(c(ii))
Calculate this maximum profit. [2]
10.
Answer the whole of this question on a sheet of graph paper.
Using a scale of 1 cm to represent 1 unit on both axes, draw x and y axes for -8 ≤ x ≤ 12 and -6 ≤ y ≤ 14.
(a)
Draw and label triangle X with vertices (2, 4), (4, 4) and (4, 1). [1]
(b)
Triangle X is mapped onto triangle U with vertices (6, 12), (12, 12) and (12, 3) by a single transformation.
(b(i))
Draw and label triangle U. [1]
(b(ii))
Describe fully this transformation. [3]
(c)
A 90° clockwise rotation about the origin maps triangle X onto triangle W. Draw and label triangle W. [2]
(d)
A shear with x-axis as the invariant line and shear factor -2 maps triangle X onto triangle S. Draw and label triangle S. [2]
(e)
Triangle X is mapped onto triangle M with vertices (4, 4), (8, 4) and (8, 1).
(e(i))
Draw and label triangle M. [1]
(e(ii))
Find the matrix which represents this transformation. [2]
11.
A farmer planted 60 fruit trees. In a certain month, the number of fruits per tree was recorded and the results were as shown in the table below.
Fruits per tree2345678Frequency1546101618
(a)
Calculate the standard deviation. [6]
(b)
Answer this part of the question on a sheet of graph paper.
(b(i))
Using the table above, copy and complete the relative cumulative frequency table below.
Fruits per tree2345678Cumulative Frequency161016264260Relative cumulative frequency0.020.10.170.27 [1]
(b(ii))
Using a scale of 1 cm to represent 1 unit on the x-axis for 0 ≤ x ≤ 8 and 2 cm to represent 0.1 units on the y-axis for 0 ≤ y ≤ 1, draw a smooth relative cumulative frequency curve. [3]
(b(iii))
Showing your method clearly, use your graph to estimate the 70th percentile. [2]
12.
(a)
Express 32x - 5 - 4x - 3 as a single fraction in its lowest terms. [3]
(b)
The diagram below shows the graph of y = x3 + x2 - 12x.
(b(i))
Use the graph to solve the equations
(b(i)(a))
x3 + x2 - 12x = 0, [2]
(b(i)(b))
x3 + x2 - 12x = x + 10. [3]
(b(ii))
Calculate an estimate of the
(b(ii)(a))
gradient of the curve at the point where x = -3, [2]
(b(ii)(b))
area bounded by the curve, x = -3, x = -1 and y = -10. [2]