
Save as PDF or print — the answers and worked solutions live online, where your work gets marked free.
Examinations Council of Zambia — past paper
ECZ 2019 O-Level Paper 1 — Mathematics
44 questions · downloaded from g12titan.com, where this paper is marked free online

1.
Shade (A∪C)'∩B in the Venn diagram in the answer space.
- A

- B

- C

- D

2.
Set A={ Prime numbers less than 12}. List set A .
- A{1,2,3,5,7,11}
- B{2,3,5,7,11}
- C{2,3,5,7,9,11}
- D{1,3,5,7,9,11}
3.
Evaluate (-1)0 × 23.
- A-8
- B1
- C8
- D2
4.
Solve the equation (x - 1)(2x + 5) = 0.
- Ax = -1 or x = 52
- Bx = 1 or x = -52
- Cx = 1 or x = 52
- Dx = -1 or x = -52
5.
Simplify 4x2 + 2y2 - xy - 6x2 + 2xy.
- A10x2 + 2y2 + xy
- B2x2 + 2y2 + xy
- C-2x2 + 2y2 - 3xy
- D-2x2 + 2y2 + xy
6.
Factorise completely 4ab + 6ac - 6bd - 9cd.
- A(2a - 3d)(2b - 3c)
- B(2a - 3d)(2b + 3c)
- C(2a + 3d)(2b + 3c)
- D(4a - 6d)(b + c)
7.
A company declared a dividend of K1.50 per share. Musalala has 600 shares in the company. How much will she get?
- AK601.50
- BK900.00
- CK400.00
- DK90.00
8.
Given that 17 + m + 27 + ... are consecutive terms of an Arithmetic Progression, find the arithmetic mean, m.
- A10
- B22
- C20
- D44
9.
For the sequence 11, 13, 15, ..., find the formula for the nth term.
- A2n + 9
- B2n + 11
- C11n + 2
- D2n - 9
10.
The transpose of a matrix A is (-1 4 5). Find the matrix A.
- A-145
- B-145
- C54-1
- D-154
11.
Given that (1 2 3) 1x5 = (24), find the value of x.
- A5
- B4
- C3
- D8
12.
A number is chosen at random from the set {1, 2, 3, 4, 5, 6, 7, 8, 9, 10}. Find the probability that it is a perfect square.
- A410
- B110
- C310
- D210
13.
Solve the equation 8x = 128.
- A73
- B3
- C7
- D37
14.
The diagram below shows a sector AOB. Arc AB subtends an angle of 21° at the centre O.
Given that the area of the sector is 14.85 cm2, calculate the radius. [π = 227]
- A9cm
- B14.85cm
- C7cm
- D81cm
15.
The diagram below shows the positions of towns A, B and C on the earth’s surface.
(a) If it is 08 20 at A, what time is it at C?
- A13 20 hours
- B08 20 hours
- C12 20 hours
- D03 20 hours
16.
The diagram below shows the positions of towns A, B and C on the earth’s surface.
(b) A plane flies from A to B at a speed of 400 knots. How long does the journey take if AB = 4 800 nm?
- A10 hours
- B1 920 000 hours
- C8 hours
- D12 hours
17.
The length of a piece of wire is measured as 4.5 cm. Calculate the tolerance.
- A0.1cm
- B0.5cm
- C0.45cm
- D0.05cm
18.
The length of a piece of wire is measured as 4.5 cm. Calculate the relative error.
- A0.05
- B19
- C9
- D190
19.
In the diagram below, A, B, C and D are points on the circumference of a circle, centre O. DÂT = 40°, BDC = 30° and AT is a tangent to the circle at A.
Calculate
(a) CBD.
- A30°
- B60°
- C40°
- D50°
20.
In the diagram below, A, B, C and D are points on the circumference of a circle, centre O. DÂT = 40°, BDC = 30° and AT is a tangent to the circle at A.
Calculate
(b) BAC.
- A60°
- B50°
- C30°
- D40°
21.
In the diagram below, A, B, C and D are points on the circumference of a circle, centre O. DÂT = 40°, BDC = 30° and AT is a tangent to the circle at A.
Calculate
(c) AOB.
- A120°
- B50°
- C100°
- D80°
22.
In the diagram below, BCD is a straight line, AB = 12cm, AC = 20cm and angle ABC = 90°.
Find the value of cos ACD.
- A-0.6
- B45
- C-0.8
- D35
23.
A and B are points with coordinates (-3, 3) and (5, 9) respectively. Find the length AB.
- A8
- B14
- C6
- D10
24.
a varies directly as b and as the square of c, and a = 30 when b = 2.5 and c = 2. Find the value of k, the constant of variation.
- A12
- B10
- C3
- D30
25.
a varies directly as b and as the square of c, and a = 30 when b = 2.5 and c = 2. Find the value of a when b = 2 and c = 3.
- A36
- B27
- C18
- D54
26.
a varies directly as b and as the square of c, and a = 30 when b = 2.5 and c = 2. Find the values of c when a = 300 and b = 4.
- Ac = 5 or c = -5
- Bc = 10 or c = -10
- Cc = 25 or c = -25
- Dc = 5 only
27.
Find ∫(3x2 + 8x - 5) dx.
- Ax3 + 8x2 - 5x + C
- Bx3 + 4x2 - 5x + C
- C6x + 8 + C
- D3x3 + 4x2 - 5x + C
28.
The diagram below shows two triangles A and B.
Describe fully the single transformation which maps triangle A onto triangle B.
- AReflection in the y-axis
- BTranslation by 6-2
- CRotation through 180° about (0, 2)
- DTranslation by -62
29.
In the diagram below, A, B and C are three points on level ground. The bearing of B from A is 062° and angle ABC = 128°. C is due east of A.
Find the bearing of
(a) C from B.
- A114°
- B128°
- C062°
- D242°
30.
In the diagram below, A, B and C are three points on level ground. The bearing of B from A is 062° and angle ABC = 128°. C is due east of A.
Find the bearing of
(b) A from C.
- A270°
- B062°
- C090°
- D114°
31.
The diagram below shows a plane figure made up of congruent semi circles. Angle AOB = 90°.
Describe fully the symmetry of the figure.
- ARotational symmetry of order 3 about O
- BLine symmetry only
- CRotational symmetry of order 2 about O
- DRotational symmetry of order 4 about O
32.
In the answer space below is an incomplete program written in pseudocode for calculating the volume V of a cuboid, given the length, l, base, b, and the height, h. Complete the program by filling in the blank spaces with appropriate statements.
- AEnter V; l = Vb*h
- BEnter l, b and h; V = l + b + h
- CEnter l and b; V = l*b
- DEnter l, b and h; V = l*b*h
33.
The functions f and g are defined by f(x) = 2x - 3 and g(x) = 3x. Find f-1(x).
- Ax + 32
- Bx + 23
- C2x + 3
- Dx - 32
34.
The functions f and g are defined by f(x) = 2x - 3 and g(x) = 3x. Find gf(x).
- A6x - 9
- B2x - 9
- C6x - 3
- D5x - 3
35.
The functions f and g are defined by f(x) = 2x - 3 and g(x) = 3x. Find gf(2).
- A3
- B6
- C9
- D1
36.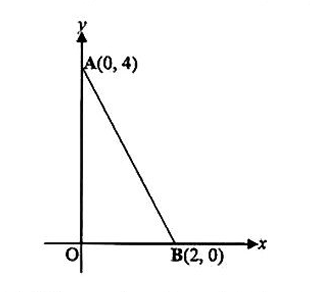
In the diagram below, A is the point (0, 4) and B is the point (2, 0) and O is the origin.
Find the equation of a straight line through O which is parallel to the line AB.
- Ay = -2x
- By = -2x + 4
- Cy = -12x
- Dy = 2x
37.
The heights of two similar cylinders are 4 cm and 6 cm. If the volume of the smaller cylinder is 48 cm3, find the volume of the larger cylinder.
- A108cm3
- B324cm3
- C162cm3
- D72cm3
38.
Write down the three inequalities that define the unshaded region R, on the diagram below.
- Ay ≥ 6; y > x - 2; y ≥ -3x + 6
- By ≤ 6; y < x - 2; y ≥ -3x + 6
- Cy ≤ 6; y > x - 2; y ≥ -3x + 6
- Dy ≤ 6; y > x - 2; y ≤ -3x + 6
39.
M is the point (0, 5) and MN = -34. Find ON.
- A09
- B-39
- C31
- D-34
40.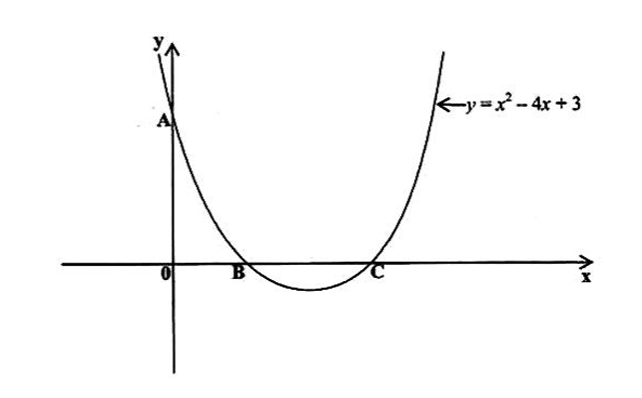
The sketch shown below represents the graph of the curve y = x2 - 4x + 3, passing through the points A, B and C.
Find the
(i) coordinates of the points B and C,
- AB(-1, 0), C(-3, 0)
- BB(1, 0), C(3, 0)
- CB(3, 0), C(1, 0)
- DB(0, 1), C(0, 3)
41.
The sketch shown below represents the graph of the curve y = x2 - 4x + 3, passing through the points A, B and C.
Find the
(ii) minimum value of y.
- A2
- B-1
- C3
- D1
42.
The diagram below is the speed time graph of a car. The car starts from rest and accelerates uniformly at 2 m/s2 for t seconds until it reaches a speed of 16 m/s. It then travels at 16 m/s for 40 seconds, after which it comes to rest in a further 10 seconds.
Find the
(a) value of t.
- A4 seconds
- B16 seconds
- C8 seconds
- D32 seconds
43.
The diagram below is the speed time graph of a car. The car starts from rest and accelerates uniformly at 2 m/s2 for t seconds until it reaches a speed of 16 m/s. It then travels at 16 m/s for 40 seconds, after which it comes to rest in a further 10 seconds.
Find the
(b) distance travelled in the last 50 seconds.
- A80m
- B800m
- C640m
- D720m
44.
The diagram below is the speed time graph of a car. The car starts from rest and accelerates uniformly at 2 m/s2 for t seconds until it reaches a speed of 16 m/s. It then travels at 16 m/s for 40 seconds, after which it comes to rest in a further 10 seconds.
Find the
(c) speed of the car when t = 53 seconds.
- A16m/s
- B5m/s
- C8m/s
- D0m/s