
Save as PDF or print — the answers and worked solutions live online, where your work gets marked free.
Examinations Council of Zambia — past paper
ECZ 2020 GCE Paper 2 — Mathematics
12 questions · downloaded from g12titan.com, where this paper is marked free online

1.
(a)
Given that matrix A = 74p95p,
(a(i))
find the value of p for which the determinant of A is -2, [2]
(a(ii))
hence, find the inverse of A. [2]
(b)
Mutola and Mwambi were to be selected as members of a netball team. The probability of selecting Mutola is 78 and that of selecting Mwambi is 910. Find the probability that
(b(i))
only one of them is selected, [3]
(b(ii))
none of them is selected. [2]
2.
(a)
Simplify y + 1y2 - 1. [2]
(b)
The sum of n terms of a geometric progression (G.P) is given by 10 - 102n. Find
(b(i))
the sum of the first 4 terms of this G.P, [2]
(b(ii))
the first term, [2]
(b(iii))
the first 4 terms. [3]
3.
(a)
Solve the equation 2x2 + 3x - 7 = 0, giving your answers correct to 2 decimal places. [5]
(b)
The Venn diagram below shows the number of students in each of the three courses at a University.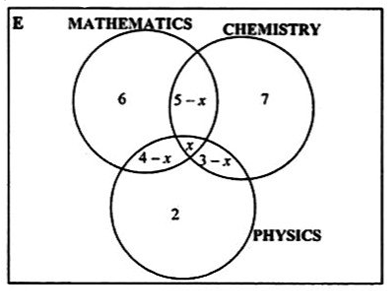
(b(i))
Given that there were 25 students altogether, find the value of x. [2]
(b(ii))
How many students studied
(b(ii)(a))
Mathematics and Chemistry only, [1]
(b(ii)(b))
one course only, [1]
(b(ii)(c))
Chemistry and Physics but not Mathematics? [1]
4.
(a)
The programme below is given in the form of a pseudocode.
Start
Enter radius
If radius < 0
Then display "error message" and re-enter positive radius
Else enter slant height
If slant height < 0
Then display "error message" and re-enter positive slant height
Else Area = π * r * (r + slant height)
End if
Display Area
Stop
Draw the corresponding flow chart for the information given above. [5]
(b)
Express 2x - 1 - 31 - x as a single fraction in its simplest form. [3]
5.
Answer the whole of this question on a sheet of plain paper.
(a(i))
Construct a quadrilateral PQRS in which QR = 6 cm, angle PQR = 90°, angle QRS = 120°, RS = 7 cm and PQ = 10 cm. [1]
(a(ii))
Measure and write the size of angle QPS. [1]
(b)
On your diagram, draw the locus of points within quadrilateral PQRS which are
(b(i))
8 cm from R, [1]
(b(ii))
equidistant from R and S, [1]
(b(iii))
equidistant from PS and RS. [2]
(c)
A point X, within quadrilateral PQRS, is such that it is less than or equal to 8 cm from R, nearer to S than R and nearer to PS than RS. Shade the region in which X must lie. [2]
6.
(a)
In the diagram below, Q is the midpoint of OC and OABP is a straight line with OA = AB = BP, OA = 2p and OQ = q.
Express in terms of p and/or q
(a(i))
OB, [1]
(a(ii))
BC, [1]
(a(iii))
AQ, [1]
(a(iv))
CP. [2]
(b)
The gradient function of a curve is 3x + 2. Find the equation of the curve if it passes through the point (0, 2). [3]
7.
Study the diagram below and answer the questions that follow.
(a)
Triangle PQR is mapped onto triangle LMN by a single transformation. Describe this transformation fully. [3]
(b)
An enlargement maps trapezium ABCD onto trapezium A1B1C1D1. Find the centre of enlargement and the scale factor. [3]
(c)
A transformation with the 100-3 maps triangle PQR onto triangle XYZ, not drawn on the diagram. Find the coordinates of X, Y and Z. [3]
(d)
Triangle LMN is mapped onto triangle L1M1N1 by a shear. Find
(d(i))
the matrix of shear, [2]
(d(ii))
the shear factor. [1]
8.
The frequency table below shows the mark distribution for 30 learners in a Mathematics test.
Marks10 < x ≤ 1515 < x ≤ 2020 < x ≤ 2525 < x ≤ 3030 < x ≤ 3535 < x ≤ 4040 < x ≤ 4545 < x ≤ 50Number of Learners23356632
(a)
Calculate the standard deviation. [6]
(b)
Answer this part of the question on a sheet of graph paper.
(b(i))
Using the information in the table above, copy and complete the relative cumulative frequency table below.
Marks≤ 15≤ 20≤ 25≤ 30≤ 35≤ 40≤ 45≤ 50Number of Learners2581319252830Relative cumulative frequency0.070.170.270.431 [1]
(b(ii))
Using a scale of 2 cm to represent 5 marks on the axis for 15 ≤ x ≤ 50 and a scale of 2 cm to represent 0.1 units on the y-axis for 0.0 ≤ y ≤ 1.0, draw a smooth relative cumulative frequency curve. [3]
(b(iii))
Showing your method clearly, use your graph to estimate the semi-interquartile range. [2]
9.
(a)
The diagram below shows the positions of a Guava (G) tree, Orange (O) tree and Lemon (L) tree on a farm.
Given that LG = 10.1 m, OG = 14.2 m and angle OLG = 40°; calculate
(a(i))
angle OGL, [5]
(a(ii))
the area of triangle OGL, [2]
(a(iii))
the shortest distance from L to OG. [2]
(b)
Solve the equation 5 cos θ = 3 for 0° ≤ θ ≤ 180°. [1]
(c)
Simplify 99m3 n220p2 q3 ÷ 33m4 n40p2 q3. [2]
10.
(a)
The diagram below shows three points P, Q and R on the surface of the earth. [Take π as 3.142 and R = 6 370 km]
(a(i))
Calculate the difference in longitude between P and R. [2]
(a(ii))
Given that the distance between P and Q on latitude X°N is 4392.079611 km, calculate X. [2]
(a(iii))
Calculate the distance QR on longitude 24° E. [2]
(b)
The figure ABCDEFGH below is a frustum of a pyramid. EFGH and ABCD are squares of sides 8 cm and 12 cm respectively.
Given that the height of the frustum is 3 cm, calculate its volume. [6]
11.
Answer the whole of this question on a sheet of graph paper.
The variables x and y are connected by the equation y = 3 - 5x + x2 + x3. Some of the corresponding values of x and y are given in the table below.
x-3-2-10123y09r30524
(a(i))
Calculate value of r. [1]
(a(ii))
Taking 2 cm to represent 1 unit on the x-axis for -3 ≤ x ≤ 3, and 2 cm to represent 10 units on the y-axis for 0 ≤ y ≤ 30, draw the graph of y = 3 - 5x + x2 + x3. [3]
(a(iii))
Use your graph to calculate an estimate of the
(a(iii)(a))
gradient of the curve at the point where x = 2, [2]
(a(iii)(b))
area bounded by the curve, x = -3 and x = -2. [3]
(b)
Find the coordinates of the stationary points on the curve y = 2x3 - 3x2 - 12x + 4. [3]
12.
Answer the whole of this question on a sheet of graph paper.
Menda intends to run a business of selling mineral water. He needs to order at least 10 small bottles and at most 60 large bottles of water. He decides to order at most 80 bottles of water altogether and the number of large bottles he orders should be at least twice that of small bottles.
(a)
Given that x is the number of small bottles and y is the number of large bottles, write four inequalities which represent these conditions. [4]
(b)
Using a scale of 2 cm to represent 10 bottles on each axis, draw the x and y axes for 0 ≤ x ≤ 80 and 0 ≤ y ≤ 80 respectively and shade the unwanted region to show clearly the region where the solution of the inequalities lie. [4]
(c)
The profit on the sale of each small bottle of mineral water is K1.50 while on each large bottle of mineral water profit is K2.50. How many bottles of each type can be bought to make maximum profit? [2]
(d)
Hence, find this maximum profit. [2]