
Save as PDF or print — the answers and worked solutions live online, where your work gets marked free.
Examinations Council of Zambia — past paper
ECZ 2022 O-Level Paper 1 — Mathematics
44 questions · downloaded from g12titan.com, where this paper is marked free online

1.
Shade (A∪B' )∩C on the diagram in the answer space below.
- A

- B

- C

- D

2.
Given that the universal set E={1,3,5,7,9,11},X={1,5,9} and Y={3,9,11}, list X∩Y'.
- A{1,5}
- B{1,9}
- C{5,7}
- D{3,11}
3.
Evaluate 32-2.
- A49
- B94
- C-0.44
- D-2.25
4.
Factorise completely 2ax + 4ay - 3bx - 6by.
- A(2a - 3b)(x + 2y)
- B(2a - 3b)(x - 2y)
- C(2a + 3b)(x + 2y)
- D(2a + 3b)(x - 2y)
5.
Simplify 3(4x - 5) + 2.
- A4x - 13
- B12x + 17
- C12x - 13
- D12x - 15
6.
Solve the equation 4y2 - 8y = 0.
- Ay = 0 or y = -2
- By = 0 or y = 2
- Cy = 2 only
- Dy = -2 or y = 2
7.
A company declared a dividend of K2.75 per share. A businessman invested 560 shares in the company. How much dividend did he get?
- AK1 400.00
- BK562.75
- CK1 540.00
- DK203.64
8.
Given that 2, -1, -4 ... are consecutive terms of an Arithmetic progression, find the
(a) common difference, d,
- A-5
- B3
- C-2
- D-3
9.
Given that 2, -1, -4 ... are consecutive terms of an Arithmetic progression, find the
(b) formula for the nth term.
- A5 - 3n
- B2 - 3n
- C5 + 3n
- D2 + 3n
10.
The probability that a boy will be late for school on any particular day is x. Find, in terms of x, the probability that he will not be late for school.
- A1 + x
- Bx
- Cx - 1
- D1 - x
11.
The vector RS = -45. Given that the coordinates of the point S are (1, 2), find the coordinates of the point R.
- A(5, -3)
- B(-3, 7)
- C(3, -5)
- D(-5, 3)
12.
The matrix M = 1527 and the matrix N = 0120. Find
(a) MT,
- A1527
- B7251
- C1257
- D5172
13.
The matrix M = 1527 and the matrix N = 0120. Find
(b) NM.
- A27210
- B10272
- C0540
- D15414
14.
The diagram shows two triangles A and B.
Describe fully the single transformation which maps triangle A onto triangle B.
- ATranslation by 01
- BReflection in the line y = 2
- CReflection in the x-axis
- DRotation 180° about (2, 2)
15.
In the following diagram, points A and B lie on latitude 60°S while point C is on latitude 30°N.
(a) The local time at A is 10 00 hours when it is 13 00 hours at B. Find the difference in longitudes between A and B.
- A45°
- B90°
- C30°
- D3°
16.
In the following diagram, points A and B lie on latitude 60°S while point C is on latitude 30°N.
(b) A plane flew from B to C at a speed of 600 knots. How long did the plane take?
- A6 hours
- B90 hours
- C9 hours
- D4.5 hours
17.
Find the gradient of the line passing through the points A(4, -6) and B(2, 4).
- A15
- B-0.2
- C5
- D-5
18.
Solve the equation 2x3 = 16.
- Ax = 4
- Bx = 2
- Cx = 8
- Dx = 16
19.
In the following diagram, AB and AC are tangents to the circle, centre O. AC and BE produced, meet at D and angle BAC = 54°.
Calculate angle
(a) ACB.
- A27°
- B90°
- C63°
- D54°
20.
In the following diagram, AB and AC are tangents to the circle, centre O. AC and BE produced, meet at D and angle BAC = 54°.
Calculate angle
(b) CBD.
- A90°
- B54°
- C63°
- D27°
21.
In the following diagram, AB and AC are tangents to the circle, centre O. AC and BE produced, meet at D and angle BAC = 54°.
Calculate angle
(c) CDB.
- A54°
- B63°
- C36°
- D27°
22.
The mass of a loaf of bread is 702.1 g, correct to 1 decimal place. Find the lower limit of the mass.
- A702.0g
- B701.6g
- C702.15g
- D702.05g
23.
The mass of a loaf of bread is 702.1 g, correct to 1 decimal place. Find the relative error in the mass of the loaf.
- A114042
- B0.05
- C11404.2
- D121
24.
Two similar solids P and Q have volumes 80cm3 and 270cm3 respectively. The height of the smaller solid is 8cm. Find the height of the larger solid.
- A27cm
- B12cm
- C18cm
- D8cm
25.
In the diagram, FGH is a straight line, FG = 8cm, EG = 10cm and angle EFG = 90°.
Find the value of sin EGH.
- A53
- B35
- C45
- D-0.6
26.
y varies directly as the square of x and inversely as z, and y = 2 when x = 4 and z = 24. Find the value of k, the constant of variation.
- A6
- B24
- C3
- D13
27.
y varies directly as the square of x and inversely as z, and y = 2 when x = 4 and z = 24. Find the value of y when x = 9 and z = 27.
- A27
- B9
- C3
- D1
28.
y varies directly as the square of x and inversely as z, and y = 2 when x = 4 and z = 24. Find the values of x when y = 8 and z = 6.
- Ax = 4 only
- Bx = 4 or x = -4
- Cx = 16 or x = -16
- Dx = 2 or x = -2
29.
The diagram below shows a regular triangular prism.
Describe the symmetry of the prism.
- ARotational symmetry of order 6 about the axis shown
- BRotational symmetry of order 2 about the axis shown
- CRotational symmetry of order 3 about the axis shown
- DNo rotational symmetry
30.
In the answer space below is an incomplete program written in pseudocode for calculating the curved surface area (A) of a cone with base radius (r) and slant height (s). Complete the program. (A = πrs)
- AEnter A; r = Aπs
- BEnter r and s; A = π*r*s
- CEnter r and h; A = π*r2*h
- DEnter r and s; A = 2π*r*s
31.
ABC is a straight line. The coordinates of the points A and B are (2, 1) and (-6, 5) respectively. Given that B is the midpoint of AC, find the coordinates of C.
- A(10, -3)
- B(-4, 6)
- C(-14, 9)
- D(-8, 4)
32.
In the diagram, AOB is a sector of a circle, centre O. Angle AOB = 72° and the radius is 14cm.
Calculate the area of the sector. [π = 227]
- A61.6cm2
- B246.4cm2
- C616cm2
- D123.2cm2
33.
Given that f(x) = 3x + 1 and g(x) = 4x - 1, find f-1(x).
- Ax - 13
- Bx + 13
- Cx - 31
- D3x - 1
34.
Given that f(x) = 3x + 1 and g(x) = 4x - 1, find f-1(-5).
- A2
- B-1.33
- C-16
- D-2
35.
Given that f(x) = 3x + 1 and g(x) = 4x - 1, find fg(x).
- A12x + 2
- B12x - 2
- C7x
- D12x - 1
36.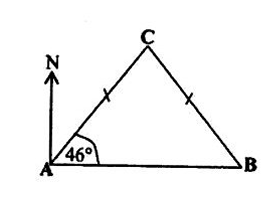
In the following diagram, angle BAC is 46° and AC = BC. B is due east of A.
Calculate the bearing of
(a) A from C.
- A316°
- B044°
- C136°
- D224°
37.
In the following diagram, angle BAC is 46° and AC = BC. B is due east of A.
Calculate the bearing of
(b) C from B.
- A316°
- B136°
- C224°
- D046°
38.
Write the four inequalities that define the unshaded region R in the diagram below.
- Ax ≥ -2; x ≤ 4; y ≥ 2; y ≤ -3x4 + 6
- Bx ≥ -2; x ≥ 4; y ≥ 2; y ≤ -3x4 + 6
- Cx ≥ -2; x ≤ 4; y ≤ 2; y ≤ -3x4 + 6
- Dx ≤ -2; x ≤ 4; y ≥ 2; y ≤ -3x4 + 6
39.
Given that y = 2x2 - 4x + 3, find dydx.
- A2x - 4
- B4x + 4
- C4x - 1
- D4x - 4
40.
The sketch shows the graph of y = x2 - 2x - 8.
Find the coordinates of
(i) A and B.
- AA(-2, 0), B(4, 0)
- BA(0, -2), B(0, 4)
- CA(2, 0), B(-4, 0)
- DA(-4, 0), B(2, 0)
41.
The sketch shows the graph of y = x2 - 2x - 8.
Find the coordinates of
(ii) the minimum point on the graph.
- A(-1, -9)
- B(1, -9)
- C(1, 9)
- D(3, -9)
42.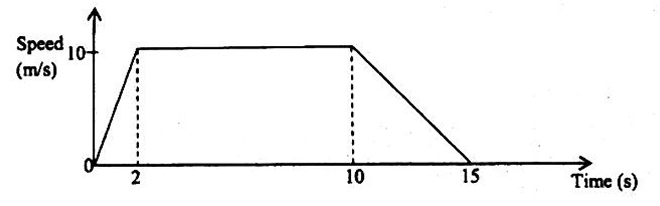
The diagram below is the speed-time graph of an object. The object starts from rest and accelerates uniformly for 2 seconds until it reaches a speed of 10m/s. It then travels at this speed for 8 seconds and finally decelerates to rest after 5 seconds.
Find the
(a) retardation of the object in the last 5 seconds.
- A10m/s2
- B12 m/s2
- C2m/s2
- D5m/s2
43.
The diagram below is the speed-time graph of an object. The object starts from rest and accelerates uniformly for 2 seconds until it reaches a speed of 10m/s. It then travels at this speed for 8 seconds and finally decelerates to rest after 5 seconds.
Find the
(b) distance travelled in the first 10 seconds.
- A80m
- B90m
- C50m
- D100m
44.
The diagram below is the speed-time graph of an object. The object starts from rest and accelerates uniformly for 2 seconds until it reaches a speed of 10m/s. It then travels at this speed for 8 seconds and finally decelerates to rest after 5 seconds.
Find the
(c) average speed of the object for the whole journey.
- A9015 m/s
- B8m/s
- C10m/s
- D233 m/s