
Save as PDF or print — the answers and worked solutions live online, where your work gets marked free.
Examinations Council of Zambia — past paper
ECZ 2024 GCE Paper 1 — Mathematics
44 questions · downloaded from g12titan.com, where this paper is marked free online

1.
Evaluate 82723.
- A49
- B23
- C64729
- D94
2.
Simplify 4(x − 2) + 3(2x − 3).
- A10x − 11
- B10x − 17
- C10x + 1
- D−2x − 17
3.
Solve the equation (3x - 5)(x + 2) = 0.
- Ax = 53 or x = -2
- Bx = 5 or x = -2
- Cx = -53 or x = 2
- Dx = 53 only
4.
Factorise completely 7x2 - 7.
- A7(x - 1)2
- B7(x - 1)(x + 1)
- C7(x2 - 1)
- D(7x - 1)(x + 1)
5.
Use set notation to describe the shaded region in the Venn diagram below.
- A(A∪B∪C)'
- BA∩(B∪C)
- CA'∪(B∩C)
- DA'∩(B∪C)
6.
A businessman got 800 shares worth K7 200.00. What was the cost of each share?
- AK90.00
- BK5,760,000.00
- CK0.09
- DK9.00
7.
The sequence 20, 17, 14, ... is an arithmetic progression. Find the 9th term.
- A-7
- B-1
- C-4
- D44
8.
The sequence 20, 17, 14, ... is an arithmetic progression. Find the sum of the first 10 terms.
- A-65
- B65
- C50
- D35
9.
A fair die is rolled once. Find the probability of a 4 showing up.
- A16
- B12
- C46
- D14
10.
In the diagram below, ABC is a straight line, AD = 5 cm, BD = 13 cm and angle BAD = 90°. Find the value of tan DBC.
- A125
- B-125
- C512
- D-512
11.
Given that the universal set E = {1, 2, 3, 4, 5, 6, 7, 8, 9}, P = {2, 4, 6, 8} and Q = {2, 3, 5, 7}. List P′ ∩ Q.
- A{3,5,7}
- B{1,3,5,7,9}
- C{2}
- D{2,3,5,7}
12.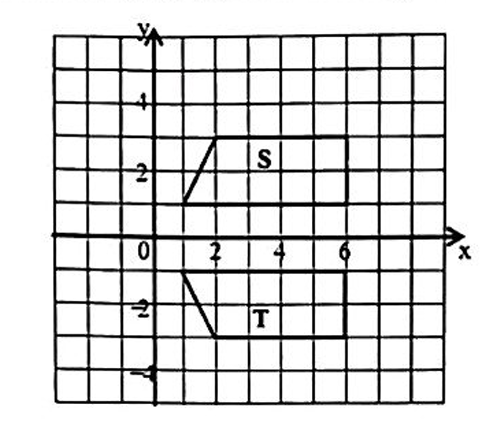
The diagram below shows trapezium S and trapezium T.
Describe fully a single transformation which maps trapezium S onto trapezium T.
- AReflection in the y-axis
- BTranslation by 0-4
- CRotation 180° about the origin
- DReflection in the x-axis
13.
Given that A = 2-13, find AT.
- A-21-3
- B2-13
- C3-12
- D2-13
14.
Given that A = 32 and B = 1−2, find AB.
- A3624
- B−1
- C3−6−24
- D3−62−4
15.
The diagram below shows positions of towns A, B and C. What is the time at A if it is 05:00 hours at B?
- A05:00 hours
- B11:00 hours
- C01:00 hours
- D09:00 hours
16.
The diagram below shows positions of towns A, B and C.
A plane flew from town A to town C in 5 hours. What was the speed of the plane in knots?
- A5400 knots
- B1080 knots
- C900 knots
- D180 knots
17.
The diagram shows a sector AOB whose area is 34.65 cm2. The angle subtended at the centre is 81° and the radius is r cm. (π = 227)
Find the radius (r) of the sector.
- A49 cm
- B14 cm
- C7 cm
- D4.95 cm
18.
The ratio of the areas of two similar solids is 9:25. If the volume of the bigger solid is 375 cm3, what is the volume of the smaller solid?
- A225 cm3
- B81 cm3
- C135 cm3
- D15 cm3
19.
Given that y varies directly as x and inversely as the square of z, and that x = 8 when y = 4 and z = 2, find the constant of variation k.
- A2
- B1
- C8
- D4
20.
Given that y varies directly as x and inversely as the square of z, and k = 2, find y when x = 18 and z = 3.
- A4
- B36
- C2
- D12
21.
Given that y varies directly as x and inversely as the square of z, and k = 2, find the values of z when x = 25 and y = 2.
- Az = 10 or z = -10
- Bz = 5 only
- Cz = 5 or z = -5
- Dz = 25 or z = -25
22.
In the diagram, P, Q, R, S are points on the circle with centre O and angle PQR = 68°. TRU is a tangent at R.
Find angle POR.
- A136°
- B44°
- C112°
- D68°
23.
In the diagram, P, Q, R, S are points on the circle with centre O and angle PQR = 68°. TRU is a tangent at R.
Find angle PSR.
- A44°
- B68°
- C136°
- D112°
24.
In the diagram, P, Q, R, S are points on the circle with centre O and angle PQR = 68°. TRU is a tangent at R.
Find angle PRO.
- A34°
- B44°
- C22°
- D68°
25.
Two points A and B have coordinates (−5, −3) and (−1, a) respectively. Given that the gradient of the line AB is 2, find the value of a.
- A-5
- B1
- C5
- D8
26.
Given that y = 4x3 - 2x2 + 1, find dydx.
- A12x - 4
- B12x2 - 4x
- C12x2 - 4x + 1
- D4x2 - 4x
27.
The length of a sugarcane is measured as 2.6 m. Its true length is 2.5 m. Find the absolute error.
- A2.5 m
- B4m
- C0.1 m
- D0.04 m
28.
The length of a sugarcane is measured as 2.6 m. Its true length is 2.5 m. Find the percentage error.
- A0.04%
- B2.50%
- C4%
- D0.10%
29.
The functions f and g are defined by f(x) = 3x - 4 and g(x) = x + 13. Find f-1(x).
- Ax + 13
- B3x + 4
- Cx - 43
- Dx + 43
30.
The functions f and g are defined by f(x) = 3x - 4 and g(x) = x + 13. Find gf(x).
- Ax - 33
- B3x - 3
- Cx + 1
- Dx - 1
31.
The functions f and g are defined by f(x) = 3x - 4 and g(x) = x + 13. Find gf(-3).
- A4
- B-4
- C-2
- D-10
32.
The diagram shows a triangular prism ABCDEF in which AE = AD = DE.
State the number of planes of symmetry for this triangular prism.
- A4
- B2
- C1
- D3
33.
A program calculates the nth term Tn of an arithmetic progression from its first term a, common difference d and term number n. Complete the program: Enter ____; Tn = ____.
- AEnter a and n; Tn = a + nd
- BEnter a, d and n; Tn = a + (n - 1)d
- CEnter Tn; Tn = a + d
- DEnter a, d and n; Tn = an + d
34.
Given that AB = 31 and BC = 1-3, find AC.
- A4-2
- B3-2
- C-42
- D24
35.
The straight line y = (12)x + p passes through (-2, 2). Find the coordinates of the y-intercept.
- A(-2, 2)
- B(0, 1)
- C(3, 0)
- D(0, 3)
36.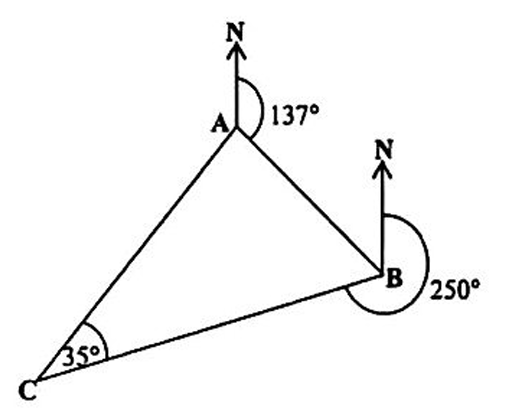
In the diagram, A, B and C are three points on level ground. The bearing of B from A is 137°, the bearing of C from B is 250° and angle ACB = 35°. Find the bearing of A from B.
- A317°
- B137°
- C043°
- D180°
37.
In the diagram, A, B and C are three points on level ground. The bearing of B from A is 137°, the bearing of C from B is 250° and angle ACB = 35°. Find the bearing of A from C.
- A105°
- B035°
- C070°
- D215°
38.
Use the diagram. Write the four inequalities that define the unshaded region R.
- Ay ≥ x; x + 2y ≥ 6; y ≥ 1; x ≤ 6
- By ≤ x; x + 2y ≥ 6; y ≥ 1; x ≤ 6
- Cy ≤ x; x + 2y ≤ 6; y ≥ 1; x ≤ 6
- Dy ≤ x; x + 2y ≥ 6; y ≤ 1; x ≥ 6
39.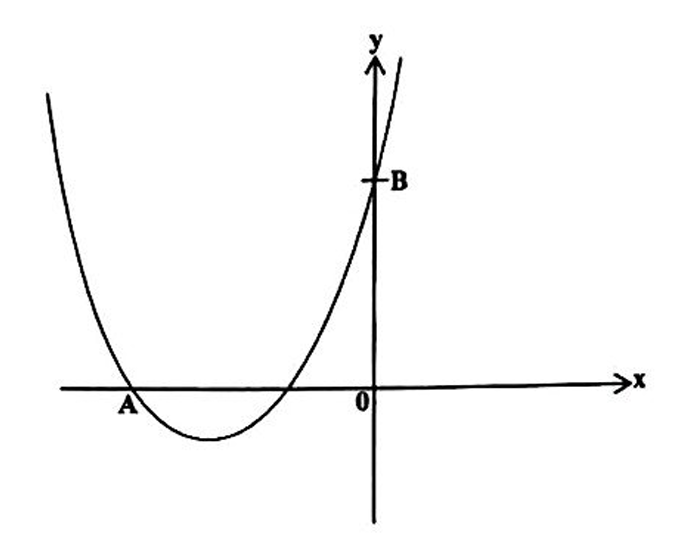
The diagram below shows a sketch of the graph of y = x2 + 3x + 2, passing through the points A and B.
Find the coordinates of A and of B.
- AA(-1, 0) and B(0, 2)
- BA(-2, 0) and B(2, 0)
- CA(-2, 0) and B(0, 2)
- DA(2, 0) and B(0, -2)
40.
The diagram below shows a sketch of the graph of y = x2 + 3x + 2, passing through the points A and B.
Find the minimum turning point.
- A(-32, 14)
- B(-3, -4)
- C(32, -14)
- D(-32, -14)
41.
Solve the equation 81 - 27x = 0.
- Ax = 4
- Bx = 34
- Cx = 43
- Dx = 3
42.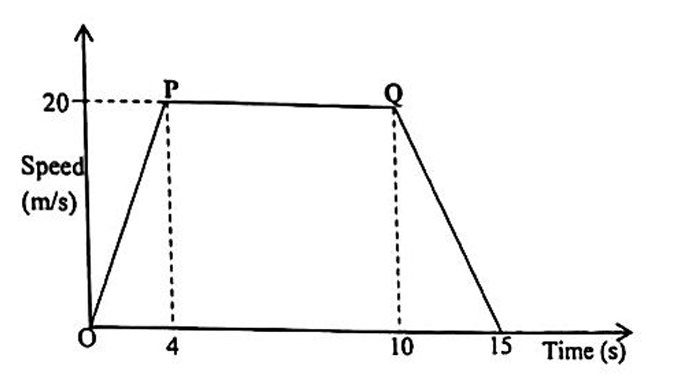
The diagram below shows the speed-time graph of an object. The object accelerates uniformly from O to P until it reaches a speed of 20 m/s in 4 seconds and then moves steadily from P to Q for 6 seconds and finally comes to rest.
Find the acceleration in the first 4 seconds.
- A80 m/s2
- B4 m/s2
- C5 m/s2
- D20 m/s2
43.
The diagram below shows the speed-time graph of an object. The object accelerates uniformly from O to P until it reaches a speed of 20 m/s in 4 seconds and then moves steadily from P to Q for 6 seconds and finally comes to rest.
Find the total distance covered by the object.
- A300 m
- B200 m
- C170 m
- D210 m
44.
The diagram below shows the speed-time graph of an object. The object accelerates uniformly from O to P until it reaches a speed of 20 m/s in 4 seconds and then moves steadily from P to Q for 6 seconds and finally comes to rest.
Find the average speed in the last 4 seconds.
- A4 m/s
- B10 m/s
- C8 m/s
- D16 m/s