
Save as PDF or print — the answers and worked solutions live online, where your work gets marked free.
Examinations Council of Zambia — past paper
ECZ 2024 GCE Paper 2 — Mathematics
12 questions · downloaded from g12titan.com, where this paper is marked free online

1.
(a)
A box contains 6 identical beads, 2 of which are red and the rest are green. Two beads are selected at random from the box, one after the other without replacement.
(a(i))
Draw a tree diagram to illustrate this information. [2]
(a(ii))
Calculate the probability that the beads selected are of different colours. [3]
(b)
The Venn diagram shows the number of elements of sets P, Q and R.
Find
(b(i))
the value of x, such that n(P) = 18, [2]
(b(ii))
n(R)', [1]
(b(iii))
n(R ∪ Q), [1]
(b(iv))
n(P ∩ Q)'. [1]
2.
Answer the whole of this question on a sheet of plain paper.
(a)
Construct a quadrilateral PQRS in which PQ = 10 cm, angle SPQ = 70°, QR = 6.5 cm, PS = 5 cm and SR = 7 cm. [1]
(b)
Measure and write the angle PQR. [1]
(c)
On your diagram, construct the locus of points within the quadrilateral PQRS which are
(c(i))
3 cm from PQ, [1]
(c(ii))
equidistant from PS and SR. [2]
(d)
L is a point inside quadrilateral PQRS such that it is 3 cm from PQ and equidistant from PS and SR. Label the point L. [1]
(e)
M is another point inside quadrilateral PQRS such that it is less than or equal to 3 cm from PQ and nearer to PS than to SR. Indicate clearly, by shading, the region in which M must lie. [2]
3.
(a)
Express 2x + 2 - 53x - 1 as a single fraction in its simplest form. [3]
(b)
In the following diagram, OA = a, OB = b and AX : AB = 2 : 3.
(b(i))
Express in terms of a and/or b
(b(i)(a))
AB, [1]
(b(i)(b))
XB, [1]
(b(i)(c))
XO. [1]
(b(ii))
Given also that OY = 3OX, show that BY = a + b. [2]
4.
(a)
Solve the equation 7 - 2x2 = x, giving your answers correct to 2 decimal places. [5]
(b)
Given that matrix B = 4x-1-3x,
(b(i))
find the value of x for which the determinant of B is 22, [2]
(b(ii))
hence, find the inverse of B. [2]
5.
(a)
Evaluate ∫2-1 (6x5 - x4 + 3x2 - 1) dx. [3]
(b)
The flowchart below shows the steps that are carried out in calculating and displaying the area (A) of a sector given its radius (r) and angle of the sector (θ).
Write a pseudocode corresponding to the flowchart program above. [5]
6.
(a)
The first three terms of a geometric progression are 3w - 2, 3w + 6 and 3w + 30. Find the
(a(i))
value of w, [3]
(a(ii))
nth term, [2]
(a(iii))
sum of the first 4 terms. [2]
(b)
Simplify 10am2 n2 ÷ 5a32m2 n2. [2]
7.
Answer the whole of this question on a sheet of graph paper.
Mapulanga's carpentry shop makes two types of chairs, type A and type B for sale. The cost of making one chair of each type is K2 000.00. The shop has K140 000.00 available for making chairs. The number of chairs of type A must be at least 20 while that of type B must be at least 10.
(a)
If x is the number of chairs of type A and y the number of chairs of type B, write three inequalities which represent these conditions. [4]
(b)
Using a scale of 2 cm to represent 10 chairs on each axis, draw x and y axes for 0 ≤ x ≤ 70 and 0 ≤ y ≤ 70 respectively and shade the unwanted region to show clearly the region where the solution of the inequalities lie. [4]
(c)
Given that the profit on a type A chair is K60.00 and on a type B is K30.00, how many chairs of each type should be made for maximum profit? [2]
(d)
Calculate the maximum profit. [2]
8.
Study the diagram below and answer the questions that follow.
(a)
Describe fully the single transformation which maps triangle ABC onto triangle GHI. [3]
(b)
Triangle ABC is mapped onto triangle PQR by an enlargement. Find the matrix representing this transformation. [3]
(c)
A stretch represented by the 1002 maps triangle ABC onto triangle DEF (not in the diagram). Find the coordinates of D, E and F. [3]
(d)
Triangle KLM is the image of triangle ABC under a shear. Find the shear factor and invariant line. [3]
9.
(a)
The diagram shows a triangle PQR in which PR = 8.9 cm, QR = 12.5 cm and angle PRQ = 130.6°.
Calculate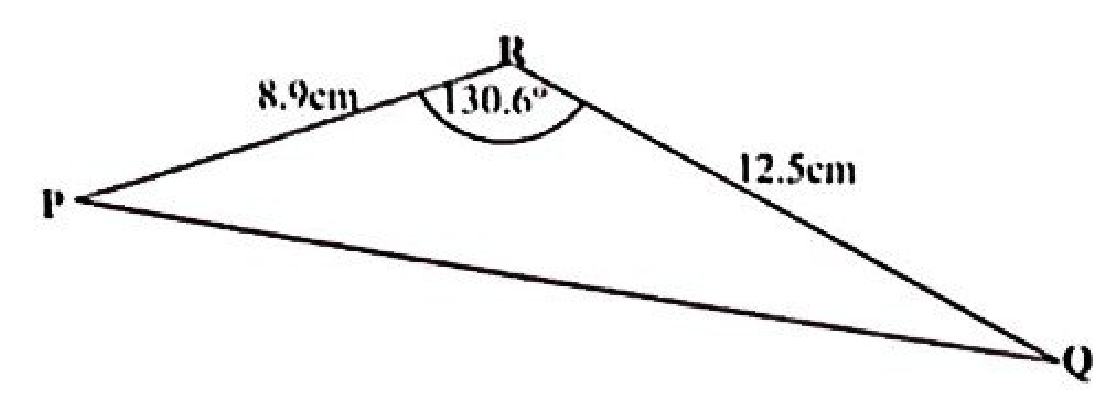
(a(i))
PQ, [5]
(a(ii))
the area of triangle PQR, [2]
(a(iii))
the shortest distance from R to PQ. [2]
(b)
Solve the equation 2 sin x = 1 for 90° ≤ x ≤ 270°. [1]
(c)
Simplify 3x3 - 6x2x2 - 2x. [2]
10.
(a)
Answer this part of the question on a sheet of graph paper.
The values of x and y are connected by the equation y = -x3 + x2 + 6x. Some corresponding values of x and y are given in the table below.
x-3-2-101234y180-40680q
(a(i))
Calculate the value of q. [1]
(a(ii))
Using a scale of 2 cm to represent 1 unit on the x-axis for -3 ≤ x ≤ 4 and 2 cm to represent 10 units on the y-axis for -30 ≤ y ≤ 20, draw the graph of y = -x3 + x2 + 6x. [3]
(a(iii))
Use your graph to
(a(iii)(a))
solve the equation -x3 + x2 + 5x = 4 - x, [3]
(a(iii)(b))
estimate the gradient of the curve at the point where x = 1. [2]
(b)
Find the equation of the normal to the curve y = x2 + x + 2 at the point (1, 4). [3]
11.
The frequency table shows the distribution of marks obtained by 50 learners in a Mathematics test.
Marks x10 < x ≤ 2020 < x ≤ 3030 < x ≤ 4040 < x ≤ 5050 < x ≤ 6060 < x ≤ 7070 < x ≤ 80Frequency371215832
(a)
Calculate the standard deviation. [6]
(b)
Answer this part of the question on a sheet of graph paper.
(b(i))
Using the information in the table above, copy and complete the cumulative frequency table below.
Marks x≤ 10≤ 20≤ 30≤ 40≤ 50≤ 60≤ 70≤ 80Cumulative frequency03102250 [1]
(b(ii))
Using a scale of 2 cm to represent 10 marks on the x-axis for 0 ≤ x ≤ 80 and 2 cm to represent 5 units on the y-axis for 0 ≤ y ≤ 50, draw a smooth cumulative frequency curve. [3]
(b(iii))
Showing your method clearly, use your graph to estimate the 70th percentile. [2]
12.
(a)
The points P(80° N, 50° W), Q(80° N, 80° E), R(50° N, 80° E) and T(50° N, 50° W) are on the surface of the earth. [π = 3.142 and R = 6 370 km]
(a(i))
Draw a sketch to represent the above information. [2]
(a(ii))
Calculate the distance
(a(ii)(a))
QR along longitude 80° E in kilometres, [2]
(a(ii)(b))
RT along latitude 50° N in kilometres. [2]
(b)
The figure below is a frustum of a cone. The base radius is 2 cm, top radius is r cm and the height is 3.6 cm. [Take π as 3.142]
Calculate the
(b(i))
value of r if the height of the cone from which the frustum was made was 6 cm, [2]
(b(ii))
volume of the frustum. [4]